BRAND IDENTITY
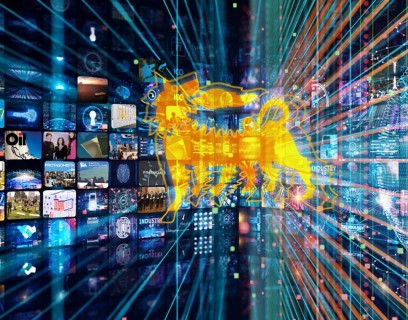
The Six-Legged Dog: Eni's brand identity and history

Or , our new artificial intelligence tool.
Via a packed portfolio of products and services and a system of partnerships with countries and businesses, we work across the world to help ensure safe and diversified energy supplies.
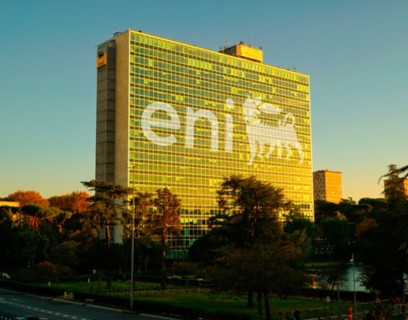
We are a global energy tech company present in 64 countries with more than 31,000 employees. The values that inspire our mission are reflected in our business model, which is based on the three goals we pursue at global level:
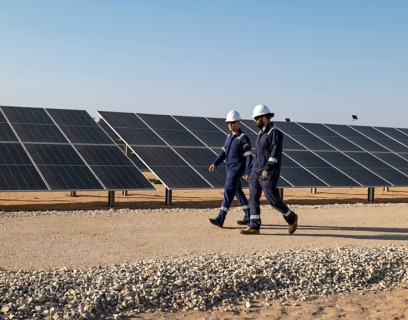
Natural gas is the focal point of our energy mix and has a key role to play in efforts to achieve the target of Net Zero emissions. At the same time, we also invest in renewable energy, biorefining and decarbonisation technologies, such as the capture and storage of CO2. To help combat the effects of climate change, we aim to achieve carbon neutrality by 2050 through an emissions reduction process that involves all of the countries in which we operate, our partners and our suppliers.
Select the view by country and project, and zoom in on the map using the side controls (+/-). Double-click the push-pins to display the information boxes.
Today it is increasingly important to pool resources and human capital, adopting a broad vision that makes it possible to align behind common goals to reduce the imbalances that exist at geographical level and promote global human progress.
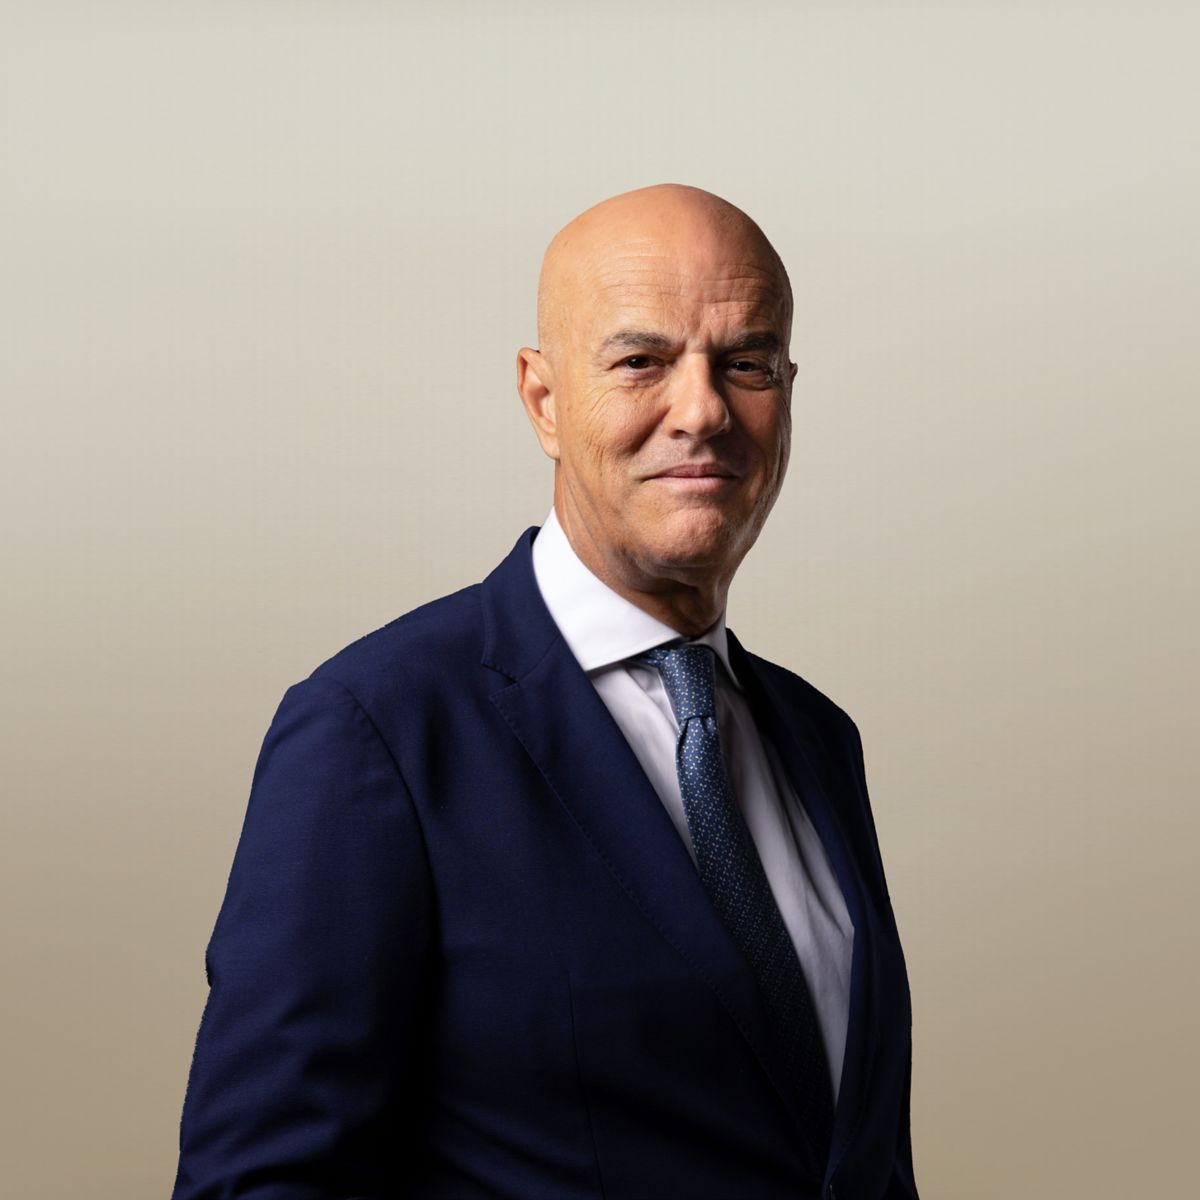
Claudio Descalzi
Chief Executive Officer of Eni
We collaborate with producer countries and business partners to diversify our sources and offer increasingly decarbonised energy services. (Source: Annual Report 2024)
in which we operated
that work in Italy and abroad
new resources (barrel of oil equivalent)
hydrocarbons production (barrel of oil equivalent per day)
(million cubic feet per day) natural gas production (out of the total hydrocarbons production)
investiments for local development
biorefinery capacity
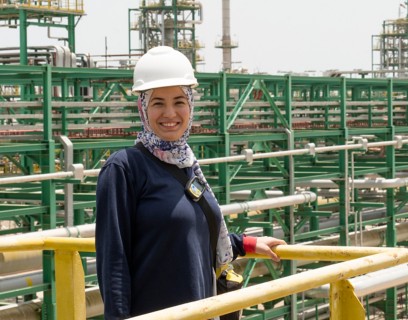
We contribute to the security of natural gas supply and the energy transition by leveraging local resources in the countries we work in.
We are present in Europe, Africa, the Americas, Asia, Oceania and the Middle East. We work to achieve a fair and socially equitable energy transition. In parallel with our energy production and transformation activities, through the partnerships we form with the countries and communities that host us, we launch initiatives that contribute to regional socio-economic development. Our core values include the promotion of personal health and safety, environmental protection and respect for human rights.
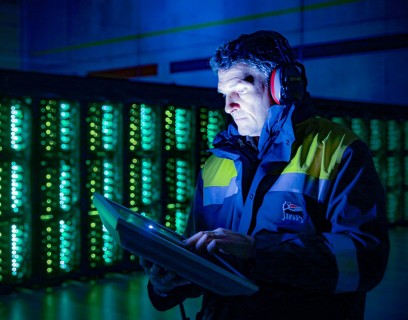
In addition to our traditional business, in Italy we are also focused on the development of renewable energy and the transformation of the company, focusing particular attention on the circularity of processes, energy security and the diversification of supplies.

Browse our voluntary sustainability report. Stories, case studies and testimonials on Eni's contribution to an increasingly sustainable, secure and affordable energy.


 Download document
