
Page 29 - EniFor2016_Performance_eng
P. 29
27
Eni for 2016 | Sustainability Performance
Innovation
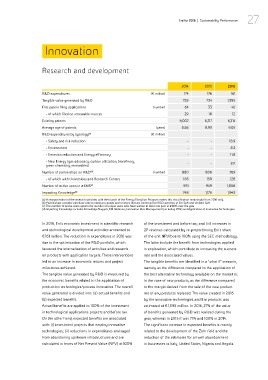
Research and development
2014 2015 2016
R&D expenditures (€ million) 174 176 161
Tangible value generated by R&D 728 734 1,395
First patent filing applications (number) 64 33 40
- of which filed on renewable sources 29 16 12
Existing patents 6,002 6,217 6,314
Average age of patents (years) 8.56 8.93 9.05
R&D expenditures by typology (a) (€ million)
- Safety and risk reduction - - 18.9
- Environment - - 8.3
- Emission reduction and Energy efficiency - - 11.8
- New Energy (gas advocacy, carbon utilization, biorefinery,
green chemistry, renewables) - - 51.1
Number of partnerships on R&D : (number) 880 806 769
(b)
- of which with Universities and Research Centers 165 159 128
Number of active users in #KMS 591 949 1,806
(c)
Impacting Knowledge (d) 748 1,176 1,943
(a) A reorganization of the research activities with the launch of the Energy Transition Program makes this classification meaningful from 2016 only.
(b) Partnerships consider purchase orders relating to goods and services that are functional to R&D activities in Eni SpA and Versalis SpA.
(c) The number of active users reports the number of unique users who have written at least one post in #KMS over the year.
(d) Impacting Knowledge includes Knowledge Nuggets, KM Webinars, Innovation Idea Management (excluding 2014) and Application of Innovative Technologies.
In 2016, Eni’s economic investment in scientific research of the investment and before tax; and (iii) increases in
and technological development activities amounted to 2P reserves calculated by re-proportioning Eni’s share
€161 million. The reduction in expenditures in 2016 was of the unit NPV/boe to 100% using the SEC methodology.
due to the optimization of the R&D portfolio, which The latter include the benefit from technologies applied
favoured the internalization of activities and research in exploration, which contribute to increasing the success
on products with application targets. These interventions rate and the associated values.
led to an increase in economic returns and project The tangible benefits are identified in a “what if” scenario,
milestones achieved. namely as the difference compared to the application of
The tangible value generated by R&D is measured by the best alternative technology available on the market or,
the economic benefits related to the application of in the case of new products, as the difference compared
production technologies/process innovation. The overall to the margin derived from the sale of the new product
value generated is divided into: (a) actual benefits and net of any products replaced. The value created in 2016
(b) expected benefits. by the innovative technologies and Eni products was
Actual benefits are applied to 100% of the investment estimated at €1,395 million. In 2016, 27% of the value
in technological applications projects and before tax. of benefits generated by R&D was realized during the
On the other hand, expected benefits are associated year, whereas in 2015 it was 71% and 100% in 2014.
with: (i) investment projects that employ innovative The significant increase in expected benefits is mainly
technologies; (ii) reductions in expenditures envisaged related to the development of the Zohr field and the
from abandoning upstream infrastructures and are reduction of the estimates for oil well abandonment
calculated in terms of Net Present Value (NPV) at 100% in businesses in Italy, United States, Nigeria and Angola.