
Page 33 - EniFor2016_Performance_eng
P. 33
31
Eni for 2016 | Sustainability Performance
their observance of HSEQ requirements, ethical and in compliance with the standards defined by Eni and
reputational reliability, economic and financial stability based on international best practices.
Local procurement in 2016 by Country
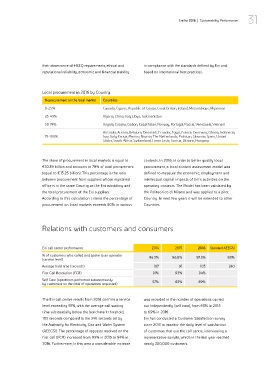
% procurement on the local market Countries
0-25% Canada, Cyprus, Republic of Congo, Great Britain, Ireland, Mozambique, Myanmar
26-49% Algeria, China, Iraq, Libya, Turkmenistan
50-74% Angola, Croatia, Gabon, Kazakhstan, Norway, Portugal, Russia, Venezuela, Vietnam
Australia, Austria, Belgium, Denmark, Ecuador, Egypt, France, Germany, Ghana, Indonesia,
75-100% Iran, Italy, Kenya, Mexico, Nigeria, The Netherlands, Pakistan, Slovenia, Spain, United
States, South Africa, Switzerland, Timor Leste, Tunisia, Ukraine, Hungary
The share of procurement in local markets is equal to contexts. In 2016, in order to better qualify local
€10.39 billion and amounts to 78% of total procurement procurement, a local content assessment model was
(equal to €13.25 billion). This percentage is the ratio defined to measure the economic, employment and
between procurement from suppliers whose registered intellectual capital impacts of Eni’s activities on the
office is in the same Country as the Eni subsidiary and operating contexts. The Model has been validated by
the total procurement of the Eni suppliers. the Politecnico di Milano and was applied to a pilot
According to this calculation criteria the percentage of Country. In next few years it will be extended to other
procurement on local markets exceeds 50% in various Countries.
Relations with customers and consumers
Eni call center performance 2014 2015 2016 Standard AEEGSI
% of customers who called and spoke to an operator
(service level) 96.3% 96.8% 97.5% 80%
Average hold time (seconds) 107 91 103 240
First Call Resolution (FCR) 91% 93% 94%
Self Care (operations performed autonomously
by customers on the total of operations requested) 57% 63% 69%
The Eni call centre results from 2016 confirm a service was recorded in the number of operations carried
level exceeding 97%, with the average call waiting out independently (self care), from 63% in 2015
time substantially below the benchmark threshold, to 69% in 2016.
103 seconds compared to the 240 seconds set by Eni has conducted a Customer Satisfaction survey
the Authority for Electricity, Gas and Water System since 2013 to monitor the daily level of satisfaction
(AEEGSI). The percentage of requests resolved on the of customers that use the call centre, interviewing a
first call (FCR) increased from 93% in 2015 to 94% in representative sample, which in the last year reached
2016. Furthermore, in this area a considerable increase nearly 200,000 customers.