
Page 26 - EniFor2016_Performance_eng
P. 26
24 Eni for 2016 | Sustainability Performance
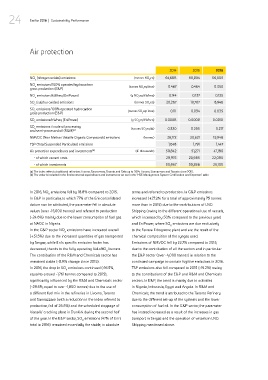
Air protection
2014 2015 2016
NO (nitrogen oxides) emissions (tonnes NO eq) 64,688 68,994 56,005
x 2
NO emissions/100% operated hydrocarbon (tonnes NO eq/ktoe)
x
gross production (E&P) 2 0.467 0.464 0.350
NO emissions/kWheq (EniPower) (g NO eq/kWheq) 0.144 0.137 0.125
x 2
SO (sulphur oxides) emissions (tonnes SO eq) 20,267 10,707 8,946
x 2
SO emissions/100% operated hydrocarbon (tonnes SO eq/ ktoe)
x
gross production (E&P) 2 0.111 0.034 0.035
SO emissions/kWheq (EniPower) (g SO eq/kWheq) 0.0008 0.0009 0.0010
x 2
SO emissions /crude oil processing (tonnes SO eq/kt)
x
and semi-processed oil (R&M) (a) 2 0.320 0.295 0.217
NMVOC (Non Methan Volatile Organic Compounds) emissions (tonnes) 26,172 20,621 15,948
TSP (Total Suspended Particulate) emissions 1,648 1,791 1,447
Air protection expenditures and investments (b) (€ thousands) 59,842 51,271 47,180
- of which current costs 28,975 20,985 22,080
- of which investments 30,867 30,286 25,100
(a) The index refers to traditional refineries: Livorno, Sannazzaro, Taranto and Gela up to 2014; Livorno, Sannazzaro and Taranto since 2015.
(b) The value is included in the Environmental expenditures and investments set out in the “HSE Management System Certification and Expenses” table.
In 2016, NO emissions fell by 18.8% compared to 2015. terms and referred to production. In G&P emissions
X
In E&P in particular, to which 77% of the Eni consolidated increased (+27.2% for a total of approximately 75 tonnes
datum can be attributed, the parameter fell in absolute more than in 2015) due to the contributions of LNG
values (over -15,000 tonnes) and referred to production Shipping (owing to the different operational use of vessels,
(-24.6%) mainly due to the lower consumption of fuel gas which increased by 50% compared to the previous year)
at NAOC in Nigeria. and EniPower, where SO emissions are due exclusively
X
In the G&P sector NO emissions have increased overall to the Ferrera Erbognone plant and are the result of the
X
(+51.5%) due to the increased quantities of gas transported chemical composition of the syngas used.
by Sergaz, while Eni’s specific emission factor has Emissions of NMVOC fell by 22.7% compared to 2015,
decreased, thanks to the fully operating VeLoNO burners. due to the contribution of all the sectors and in particular
X
The contribution of the R&M and Chemicals sector has the E&P sector (over -4,000 tonnes) in relation to the
remained stable (-0.9% change since 2015). continued campaign to contain fugitive emissions in 2016.
In 2016, the drop in SO emissions continued (-16.5%, TSP emissions also fell compared to 2015 (-19.2%) owing
X
equal to around –1,761 tonnes compared to 2015), to the contributions of the E&P and R&M and Chemicals
significantly influenced by the R&M and Chemicals sector sectors. In E&P, the trend is mainly due to activities
(-29.5%, equal to over -1,800 tonnes) due to the use of in Nigeria, Indonesia, Egypt and Angola. In R&M and
a different fuel mix in the refineries in Livorno, Taranto Chemicals, the trend is attributed to the Taranto Refinery
and Sannazzaro (with a reduction in the index referred to due to the different set-up of the systems and the lower
production, fall of 26.5%) and the scheduled stoppage of consumption of fuel oil. In the G&P sector, the parameter
Versalis’ cracking plant in Dunkirk during the second half has instead increased as a result of the increases in gas
of the year. In the E&P sector, SO emissions (47% of Eni’s transport in Sergaz and the operation of vessels in LNG
X
total in 2016) remained essentially the stable, in absolute Shipping mentioned above.