
Page 34 - EniFor2016_Performance_eng
P. 34
32 Eni for 2016 | Sustainability Performance
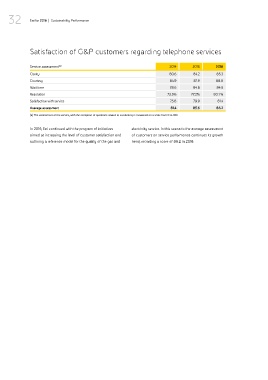
Satisfaction of G&P customers regarding telephone services
Service assessment (a) 2014 2015 2016
Clarity 80.6 84.2 85.3
Courtesy 84.9 87.9 88.8
Wait time 78.6 84.6 84.5
Resolution 72.5% 77.2% 80.1 %
Satisfaction with service 75.8 79.9 81.4
Average assessment 81.4 85.6 86.2
(a) The assessment of the service, with the exception of questions related to resolutions, is measured on a scale from 0 to 100.
In 2016, Eni continued with the program of initiatives electricity service. In this scenario the average assessment
aimed at increasing the level of customer satisfaction and of customers on service performance continues its growth
outlining a reference model for the quality of the gas and trend, recording a score of 86.2 in 2016.