
Page 24 - EniFor2016_Performance_eng
P. 24
22 Eni for 2016 | Sustainability Performance
Protection of water and biodiversity
2014 2015 2016
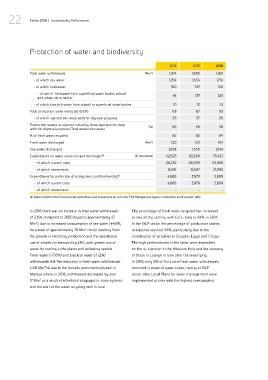
Total water withdrawals (Mm ) 3 1,874 1,805 1,851
- of which sea water 1,704 1,634 1,710
- of which freshwater 160 157 130
- of which: freshwater from superficial water bodies, subsoil
and urban net or tanker 141 137 120
- of which brackish water from subsoil or superficial water bodies 10 13 12
Total production water extracted (E&P) 63 67 65
- of which injected into deep wells for disposal purposes 35 37 38
Production waters re-injected including those injected into deep (%)
wells for disposal purposes/Total production water 56 56 58
% of fresh water recycled 82 82 84
Fresh water discharged (Mm ) 3 120 120 104
Sea water discharged 1,628 1,539 1,634
Expenditures on water resources and discharges (a) (€ thousands) 42,823 82,286 75,453
- of which current costs 26,232 66,599 53,558
- of which investments 16,591 15,687 21,895
Expenditures for protection of ecosystems and biodiversity (a) 4,668 3,979 3,899
- of which current costs 4,668 3,979 3,899
- of which investments - - -
(a) Data included in the Environmental expenditures and investments set out in the “HSE Management System Certification and Expenses” table.
In 2016 there was an increase in total water withdrawals The percentage of fresh water recycled has increased
of 2.6% compared to 2015 (equal to approximately 47 across all the sectors, with Eni’s rising to 84% in 2016.
Mm ), due to increased consumption of sea water (+4.6%, In the E&P sector the percentage of production waters
3
for a total of approximately 76 Mm more) resulting from re-injected reached 58%, particularly due to the
3
the growth in electricity production and the operational contribution of activities in Ecuador, Egypt and Congo.
use of vessels for transporting LNG, with greater use of The high performances in the latter were dependent
water for cooling in the plants and ballasting vessels. on the re-injection in the Mboundi field and the recovery
Fresh water (-17.6%) and brackish water (-11.2%) of those in Loango in June after the revamping.
withdrawals fell. The reduction in fresh water withdrawals In 2016, only 5% of Eni’s total fresh water withdrawals
3
(-28 Mm ) is due to the Versalis petrochemical plant in occurred in areas of water stress, mostly at E&P
Mantua where, in 2016, withdrawals decreased by over sector sites. Local Plans for water management were
17 Mm as a result of scheduled stoppages in some systems implemented at sites with the highest consumption.
3
and the start of the water recycling tank in June.