
Page 25 - EniFor2016_Performance_eng
P. 25
23
Eni for 2016 | Sustainability Performance
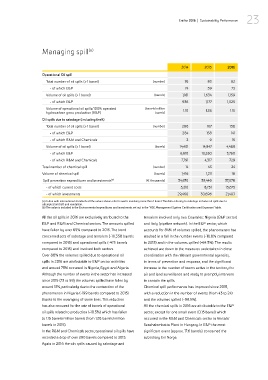
Managing spill (a)
2014 2015 2016
Operational Oil spill
Total number of oil spills (> 1 barrel) (number) 76 83 82
- of which E&P 74 59 73
Volume of oil spills (> 1 barrel) (barrels) 1,161 1,634 1,159
- of which E&P 936 1,177 1,025
Volume of operational oil spills/100% operated (barrels/million
hydrocarbon gross production (E&P) barrels) 1.10 1.28 1.15
Oil spills due to sabotage (including theft)
Total number of oil spills (> 1 barrel) (number) 286 167 156
- of which E&P 284 158 141
- of which R&M and Chemicals 2 9 15
Volume of oil spills (> 1 barrel) (barrels) 14,401 14,847 4,489
- of which E&P 6,610 10,530 3,760
- of which R&M and Chemicals 7,791 4,317 729
Total number of chemical spill (number) 14 43 24
Volume of chemical spill (barrels) 1,416 1,211 18
Spill prevention expenditures and investments (b) (€ thousands) 34,670 39,446 37,078
- of which current costs 5,210 8,751 15,675
- of which investments 29,460 30,696 21,403
(a) In line with international standards all the values above refer to events involving more than 1 barrel. The data referring to sabotage includes oil spills due to
attempted oil theft and vandalism.
(b) The value is included in the Environmental expenditures and investments set out in the “HSE Management System Certification and Expenses” table.
All the oil spills in 2016 are exclusively attributed to the terrorism involved only two Countries: Nigeria (E&P sector)
E&P and R&M and Chemical sectors. The amounts spilled and Italy (pipeline network). In the E&P sector, which
have fallen by over 65% compared to 2015. The trend accounts for 84% of volumes spilled, the phenomenon has
concerned acts of sabotage and terrorism (-10,358 barrels resulted in a fall in the number events (-10.8% compared
compared to 2015) and operational spills (-475 barrels to 2015) and in the volumes spilled (-64.3%). The results
compared to 2015) and involved both sectors. achieved are down to the measures undertaken in close
Over 88% the volumes spilled due to operational oil coordination with the relevant governmental agencies,
spills in 2016 are attributable to E&P sector activities in terms of prevention and response, and the significant
and around 75% occurred in Nigeria, Egypt and Algeria. increase in the number of teams active in the territory for
Although the number of events in the sector has increased air and land surveillance and ready to promptly intervene
since 2015 (73 vs 59), the volumes spilled have fallen by to contain the spills.
around 13%, particularly due to the contraction of the Chemical spill performance has improved since 2015,
phenomenon in Nigeria (-199 barrels compared to 2015) with a reduction in the number of events (from 43 to 24)
thanks to the revamping of some lines. This reduction and the volumes spilled (-98.5%).
has also occurred for the rate of barrels of operational All the chemical spills in 2016 are attributable to the E&P
oil spills related to production (-10.5%) which has fallen sector, except for one small event (0.15 barrel) which
to 1.15 barrels/million barrels (from 1.28 barrels/million occurred in the R&M and Chemicals sector in Versalis’
barrels in 2015). Szazhalombatta Plant in Hungary. In E&P the most
In the R&M and Chemicals sector, operational oil spills have significant event (approx. 17.6 barrels) concerned the
recorded a drop of over 290 barrels compared to 2015. subsidiary Eni Norge.
Again in 2016 the oils spills caused by sabotage and