
Page 20 - EniFor2016_Performance_eng
P. 20
18 Eni for 2016 | Sustainability Performance
with responsibilities and young graduates stand at 72% instruments and processes, also at international level.
and 70% respectively, with significant increases in foreign In the potential evaluation process, 73% of Potential
companies (+12%). Assessments were carried out (using the methodologies of
Compared to 2015, under the annual review the mapping the Development Center, Assessment Center and Focused
of senior management through the management review Interviews) in respect to the number planned by the Business
was almost complete and there has been an increase Areas, demonstrating an improvement trend at global level
of +3% of the target population (senior and middle (+3%). Over recent years this process was applied in a more
managers, young graduates). Furthermore, there has selective manner, especially in international contexts, due to
been strong growth, particularly in the young graduate logistics and costs, although an increase in activities of 9%
target, and specifically with regard to 3-7 years of service: was recorded compared to 2015.
+12% at global level, +16% in foreign companies only, In 2016, over 100 resources (senior and middle managers)
demonstrating an ever more influential use of these were assessed using Management Appraisal.
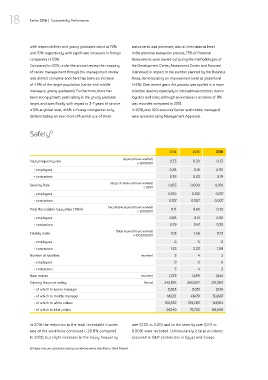
Safety 6
2014 2015 2016
(injuries/hours worked)
Injury frequency rate 0.33 0.20 0.23
x 1,000,000
- employees 0.28 0.19 0.30
- contractors 0.35 0.20 0.19
(days of absence/hours worked)
Severity Rate 0.015 0.009 0.010
x 1,000
- employees 0.010 0.012 0.017
- contractors 0.017 0.007 0.007
(recordable injuries/hours worked)
Total Recordable Injury Rate (TRIR) 0.71 0.45 0.35
x 1,000,000
- employees 0.56 0.41 0.36
- contractors 0.79 0.47 0.35
(fatal injuries/hours worked)
Fatality index 1.03 1.46 0.72
x 100,000,000
- employees 0 0 0
- contractors 1.53 2.23 1.09
Number of fatalities (number) 3 4 2
- employees 0 0 0
- contractors 3 4 2
Near misses (number) 1,729 1,489 1,644
Training Hours on safety (hours) 245,976 260,557 251,383
- of which to senior manager 3,283 3,031 2,145
- of which to middle manager 46,021 41,479 30,887
- of which to white collars 130,532 139,293 149,514
- of which to blue collars 66,140 76,755 68,836
In 2016 the reduction in the total recordable injuries rate (0.23 vs 0.20) and in the severity rate (0.01 vs
rate of the workforce continued (-20.8% compared 0.009) were recorded. Unfortunately 2 fatal accidents
to 2015), but slight increases in the Injury frequency occurred to E&P contractors in Egypt and Congo.
6) Injury rates are calculated only by considering events classified as Work Related.