
Page 15 - EniFor2016_Performance_eng
P. 15
13
Eni for 2016 | Sustainability Performance
and stemmed from the streamlining of international parties, including the R&M commercial companies of
resources mainly associated with the initiatives to eastern Europe (Romania, Slovakia, Czech Republic,
streamline upstream activities. The balance between hires Hungary and Slovenia) which impacted approximately
and terminations abroad is -724 (+520 – 1,244) and this 300 resources, and 36 resources dedicated to free market
dynamic can be traced to the re-dimensioning of gas in the gas business in Hungary.
activities in Hungary and the re-dimensioning of some Still compared to 2014, there has been an increase in
upstream projects in USA, Turkmenistan, Nigeria, Pakistan, employment in companies not consolidated using the
and the reinforcement of activities in Indonesia, Ghana line-by-line method equal to +3,558 people (+15.7%) and
and Mexico. particularly of local employees equal to +3,730 (+17%)
A total of 1,880 expatriates are working abroad (of against a reduction of overseas personnel of -172 (-23.6%).
which 1,358 Italian expatriates), an increase compared The average age of Eni people in the world is 44.8 years
to 2014 (+152 Italian expatriates) equal to 12.6%. In local old, of which 46.0 years old for resources working in
employees there is an overall reduction of 1,016 resources Italy and 42.9 years old for resources working abroad,
compared to 2014 equal to -8.9%, due, in addition to the with an increase in the overall average age of 0.7 years
effect of managerial efficiencies, to transfers to third compared to 2015.
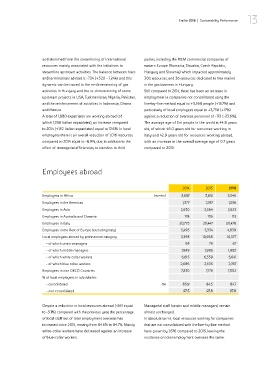
Employees abroad
2014 2015 2016
Employees in Africa (number) 3,587 3,612 3,546
Employees in the Americas 1,377 1,297 1,236
Employees in Asia 2,630 2,564 2,523
Employees in Australia and Oceania 178 135 113
Employees in Italy 20,775 20,447 20,476
Employees in the Rest of Europe (excluding Italy) 5,493 5,334 4,839
Local employees abroad by professional category 11,393 10,938 10,377
- of which senior managers 93 79 67
- of which middle managers 1,999 1,985 1,902
- of which white collar workers 6,615 6,339 5,641
- of which blue collar workers 2,686 2,535 2,767
Employees in non OECD Countries 7,230 7,176 7,002
% of local employees in subsidiaries
- consolidated (%) 85.9 84.5 84.7
- non consolidated 97.5 97.8 97.8
Despite a reduction in local resources abroad (-561 equal Managerial staff (senior and middle managers) remain
to -5.1%) compared with the previous year, the percentage almost unchanged.
of local staff out of total employment overseas has In absolute terms, local resources working for companies
increased since 2015, moving from 84.5% to 84.7%. Mainly that are not consolidated with the line-by-line method
white-collar workers have decreased against an increase have grown by 1,676 compared to 2015, leaving the
of blue-collar workers. incidence on total employment overseas the same.