
Page 11 - EniFor2016_Performance_eng
P. 11
9
Eni for 2016 | Sustainability Performance
Energy
and climate
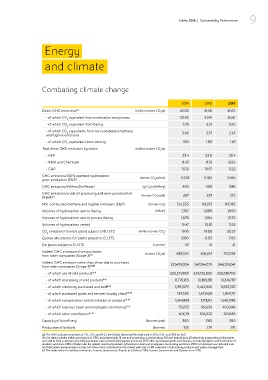
Combating climate change
2014 2015 2016
Direct GHG emissions (a) (million tonnes CO eq) 42.02 41.56 40.10
2
- of which CO equivalent from combustion and process 30.92 31.49 30.61
2
- of which CO equivalent from flaring 5.73 5.51 5.40
2
- of which CO equivalents from non-combusted methane 3.48 2.77 2.43
2
and fugitive emissions
- of which CO equivalents from venting 1.89 1.80 1.67
2
Total direct GHG emissions by sector: (million tonnes CO eq)
2
- E&P 23.4 22.8 20.4
- R&M and Chemicals 8.45 8.19 8.50
- G&P 10.12 10.57 11.22
GHG emissions/100% operated hydrocarbon (tonnes CO eq/toe) 0.201 0.182 0.166
gross production (E&P) 2
GHG emissions/kWheq (EniPower) (gCO eq/kWheq) 409 409 398
2
GHG emissions/crude oil processing and semi-processed oil (tonnes CO eq/kt) 287 237 272
(R&M) (c) 2
Non-combusted methane and fugitive emissions (E&P) (tonnes CH ) 124,553 99,013 84,785
4
Volumes of hydrocarbon sent to flaring (MSm ) 3 1,767 1,989 1,950
Volumes of hydrocarbon sent to process flaring 1,678 1,564 1,530
Volumes of hydrocarbon vented 15.47 10.81 11.52
CO emissions from Eni plants subject to EU ETS (million tonnes CO ) 19.16 19.68 20.27
2 2
Quotas allocated to Eni plants subject to EU ETS 8.80 6.83 7.06
Eni plants subject to EU ETS (number) 43 41 41
Indirect GHG emissions from purchases (tonnes CO eq)
from other companies (Scope 2) (a) 2 687,554 616,267 710,558
Indirect GHG emissions other than those due to purchases
from other companies (Scope 3) (a)(b) 221,439,934 247,764,279 246,139,041
- of which use of sold products (b-i) 205,571,088 229,135,805 225,619,708
- of which processing of sold products (b-i) 8,718,185 10,189,811 10,614,787
- of which electricity purchased and sold (b-ii) 5,381,573 5,442,945 5,857,207
- of which purchased goods and services (supply chain) (b-iii) 197,384 1,421,428 1,943,711
- of which transportation and distribution of products (b-iv) 1,049,981 1,171,214 1,440,998
- of which business travel and employees commuting (b-v) 115,613 99,054 400,946
- of which other contribution (b-vi) 406,111 304,022 261,685
Capacity of biorefinery (ktonnes/year) 360 360 360
Production of biofuels (ktonnes) 105 179 191
(a) The GHG includes emissions of CO , CH and N O; the Global Warming Potential used is 25 for CH and 298 for N O.
2
4
4
2
2
(b) The data includes indirect emissions of GHG associated with (i) use and processing o sold products (oil and natural gas), (ii) electricity produced by third parties
and sold to final customers, (iii) drilling activities outsourced to third parties and since 2015 other purchased goods and services, (iv) transportation and distribution of
products and since 2016 includes also the vessels used by Upstream, (v) business travel and employees commuting and since 2016 for Upstream are included cars
and helicopters transportation to sites, (vi) other minor contributions associated with end-of-life treatment of lubricating products and waste management.
(c) The index refers to traditional refineries: Livorno, Sannazzaro, Taranto and Gela in 2014; Livorno, Sannazzaro and Taranto since 2015.