
Page 13 - EniFor2016_Performance_eng
P. 13
11
Eni for 2016 | Sustainability Performance
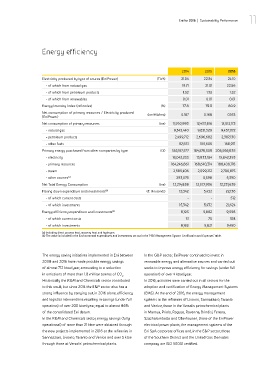
Energy efficiency
2014 2015 2016
Electricity produced by type of source (EniPower) (TWh) 21.04 22.34 24.10
- of which from natural gas 19.71 21.01 22.56
- of which from petroleum products 1.32 1.32 1.52
- of which from renewables 0.01 0.01 0.01
Energy Intensity Index (refineries) (%) 77.8 79.9 80.9
Net consumption of primary resources / Electricity produced (toe/MWheq)
(EniPower) 0.167 0.168 0.163
Net consumption of primary resources (toe) 11,930,983 12,433,816 12,013,173
- natural gas 9,343,440 9,631,529 9,457,072
- petroleum products 2,499,712 2,696,682 2,387,130
- other fuels 87,831 105,605 168,971
Primary energy purchased from other companies by type (GJ) 185,167,577 184,578,309 206,956,835
- electricity 18,042,233 13,833,184 15,842,393
- primary resources 164,246,861 168,640,314 188,408,178
- steam 2,585,406 2,099,212 2,700,875
- other sources (a) 293,076 5,598 5,390
Net Total Energy Consumption (toe) 12,214,838 12,577,906 12,231,639
Flaring down expenditure and investments (b) (€ thousands) 15,342 5,432 22,136
- of which current costs - - 512
- of which investments 15,342 5,432 21,624
Energy efficiency expenditure and investments (b) 8,193 5,892 9,558
- of which current costs 31 70 108
- of which investments 8,162 5,821 9,450
(a) Including direct process heat, recovery heat and hydrogen.
(b) The value is included in the Environmental expenditures and investments set out in the “HSE Management System Certification and Expenses” table.
The energy saving initiatives implemented in Eni between In the G&P sector, EniPower continued to invest in
2008 and 2016 have made possible energy savings renewable energy and alternative sources and carried out
of almost 712 ktoe/year, amounting to a reduction works to improve energy efficiency for savings (under full
in emissions of more than 1.8 million tonnes of CO . operation) of over 4 ktoe/year.
2
Historically the R&M and Chemicals sector contributed In 2016, activities were carried out in all sectors for the
to this result, but since 2014 the E&P sector also has a adoption and certification of Energy Management Systems
strong influence by carrying out, in 2016 alone, efficiency (EMS). At the end of 2016, the energy management
and logistics interventions resulting in savings (under full systems in the refineries of Livorno, Sannazzaro, Taranto
operation) of over 200 ktoe/year, equal to almost 86% and Venice, those in the Versalis petrochemical plants
of the consolidated Eni datum. in Mantua, Priolo, Ragusa, Ravenna, Brindisi, Ferrara,
In the R&M and Chemicals sector, energy savings (fully Szazhalombatta and Oberhausen, those of the EniPower
operational) of more than 21 ktoe were obtained through electrical power plants, the management systems of the
the new projects implemented in 2016 at the refineries in Eni SpA corporate offices and, in the E&P sector, those
Sannazzaro, Livorno, Taranto and Venice and over 5 ktoe of the Southern District and the United Gas Derivates
through those at Versalis’ petrochemical plants. company are ISO 50001 certified.