
Page 40 - EniFor2016_Report_eng
P. 40
38 Eni for 2016 | Operating model
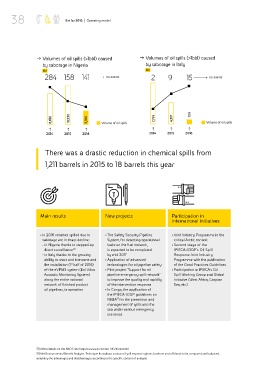
˛ Volumes of oil spills (>1bbl) caused ˛ Volumes of oil spills (>1bbl) caused
by sabotage in Nigeria by sabotage in Italy
bbl bbl
284 158 141 no. events 2 9 15 no. events
6,610 10,530 3,760 Volume of oil spills 7,791 4,317 729 Volume of oil spills
2014 2015 2016 2014 2015 2016
There was a drastic reduction in chemical spills from
1,211 barrels in 2015 to 18 barrels this year
Main results New projects Participation in
international initiatives
• In 2016 volumes spilled due to • The Safety Security Pipeline • Joint Industry Programme in the
sabotage are in sharp decline: System, for detecting operational critical Arctic context
- in Nigeria thanks to stepped-up leaks on the fuel network, • Second stage of the
direct surveillance 30 is expected to be completed IPIECA-IOGP’s Oil Spill
- in Italy thanks to the growing by mid 2017 Response Joint Industry
ability to react and intervene and • Application of advanced Programme with the publication
the installation (1 half of 2016) technologies for oil pipeline safety of the Good Practices Guidelines
st
of the eVPMS system (Eni Vibro • Pilot project “Support for oil • Participation in IPIECA’s Oil
Acoustic Monitoring System) pipeline emergency spill network” Spill Working Group and Global
along the entire national to improve the quality and rapidity Initiative (West Africa, Caspian
network of finished product of the intervention response Sea, etc.)
oil pipelines, in operation • In Congo, the application of
the IPIECA-IOGP guidelines on
NEBA for the prevention and
31
management of spills into the
sea under various emergency
scenarios
30) More details on the NAOC site https://www.eni.com/en_NG/home.html
31) Net Environmental Benefit Analysis: Technique that allows various oil spill response options (onshore and offshore) to be compared and balanced,
weighting the advantages and disadvantages according to the specific context of analysis.